Give tutoring a place in the schedule.
Many districts incorporated sessions into their master schedules, making tutoring a planned part of the school day.
Ohio · Statewide program · 2024–25
Ohio schools built on their first year of virtual tutoring, making math and ELA support part of more students’ regular learning routines.
The implementation story
The 2024–25 program followed Ohio’s first statewide year in 2023–24. Returning schools brought experience with the schedules, routines, and coordination that virtual tutoring requires.
Explore the first-year case studyMany districts incorporated sessions into their master schedules, making tutoring a planned part of the school day.
Teachers, administrators, and tutors coordinated support with classroom instruction while responding to students’ learning needs.
Mastery checks, attendance, and tutor feedback helped teams refine instruction and address scheduling challenges throughout the year.
Academic progress
Baseline and final program checks show how the mastery distribution shifted in each subject. These percentages describe a different measure from the 44.6% overall growth figure.
Share in the highest level of the program’s four-point mastery scale.
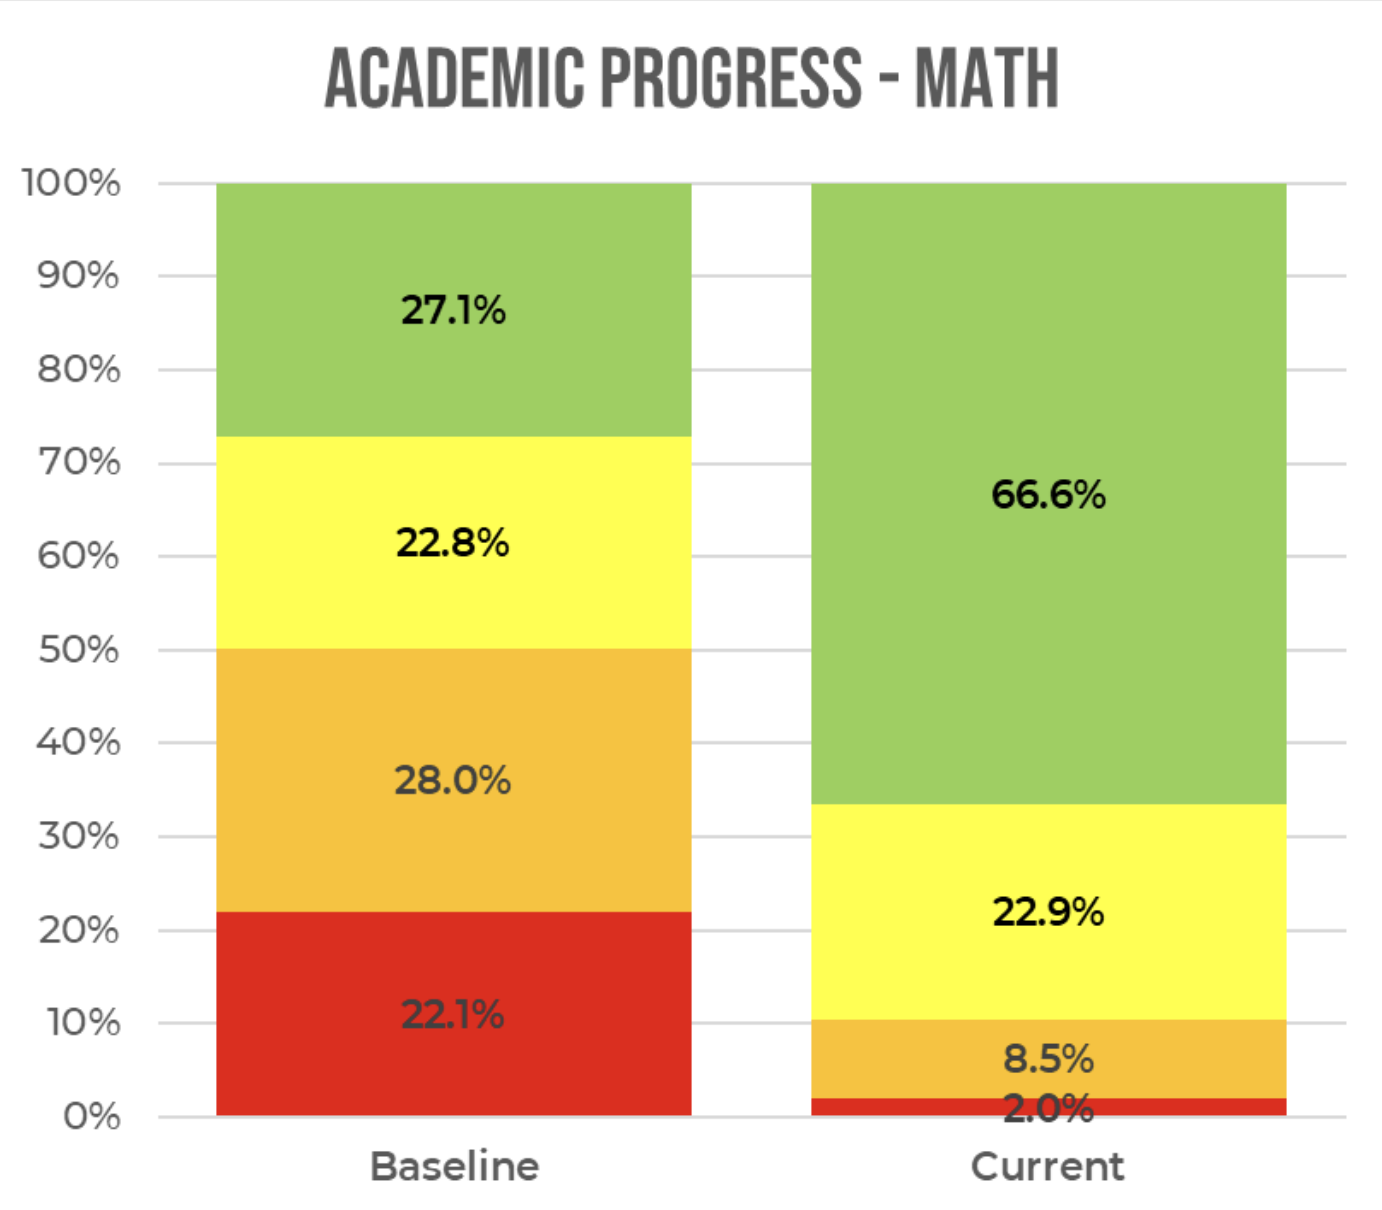
Share in the highest level of the program’s four-point mastery scale.

Foundational reading
Reading growth uses the program’s reading measure. It is separate from mastery-check results and is not a guarantee of the same pace for other students.
The published summary also reported 92.4% of standards encountered at mastery or near mastery. Results varied by school; Plymouth High’s reported standards progress exceeded 132%.
Read the measurement notesParticipation matters
Attendance, active participation, and contact hours offer three distinct views of implementation. Statewide averages also make the remaining scheduling challenge visible.
Average of participating school and district program attendance rates.
Tutor-reported participation, averaged by program.
Average hours per student, compared with a statewide goal of 50 hours.
Three benchmarks, one fuller picture
70.1%Students meeting more benchmarks also averaged more standards mastered or improved. This comparison shows an association within the program; it does not isolate cause and effect.
Grouped by number of engagement benchmarks met: attendance, participation, and contact hours.
The student experience
Student survey responses add another perspective: relationships, collaboration, understanding, and persistence.
Reported strong, positive relationships with their tutors.
Said sessions encouraged meaningful collaboration.
Reported developing a stronger understanding of concepts.
Reported learning to persist through meaningful challenges.
Percentages reflect reported student survey responses from this implementation.
Our 6-8 ELA teacher recently shared an inspiring moment that occurred before our winter benchmark testing. A seventh grader said she was excited to take the reading diagnostic because she felt she was going to do really well, thanks to what she was learning in tutoring with Cignition. She grew 100 points from fall to winter, which was the encouragement she needed to continue her positive growth mindset.
Read the evidence in context
This case describes the 2024–25 Ohio implementation. Schools served different students and operated under different scheduling conditions.
These observational findings do not establish that tutoring alone caused the outcomes, or predict results for another school.
The published summary reports overall percentage growth from baseline to final program mastery checks across key math and ELA standards. It is not a 44.6-percentage-point gain or a state-test proficiency rate.
The subject charts show the share in the highest level of a four-point mastery scale: math moved from 27.1% to 66.6%, and ELA from 32.7% to 69.6%. These are distributions at two points in time, rather than the overall growth calculation.
The program reported 10 months of average reading growth. For K–3 participants, it reported one month of reading growth per 2.8 tutoring hours. These estimates use a separate reading measure and should not be compared directly with mastery percentages.
Attendance and active participation were averaged by program; participation was tutor-reported. Contact time was reported as average hours per student. Student survey percentages describe students’ reported experiences, not independent academic assessments.
Build on the lessons
Start with your students’ needs, the time available, and how your team will use evidence to keep improving.